Stepwise Time in Status for Jira

See where work gets stuck

Late again, and nobody knows why? One report shows how long work waits in every status, which work items are stuck and how long delivery really takes. In working hours, from the history Jira already keeps. No spreadsheet, nothing to set up.

  • One report instead of a spreadsheet
  • Working hours, not weekends
  • Reads only. Built on Forge, no external servers
The Time in status report in Jira: one bar for each status. In Review is the longest bar and is ringed; a large number next to it says work items wait there 7d 11h on average.

Jira shows where work is now. Stepwise Time in Status shows how long it sat there.

See which status eats your days

Average and median time in every status, by sprint, epic, assignee or work type. The bottleneck is the longest bar.

Know how long work really takes

Cycle time and lead time from your own start and end statuses, sprint by sprint. Stop guessing delivery dates.

Count working hours, not weekends

Your working days, hours, holidays and time zone. Work handed over on Friday evening did not wait three days.

What changes for your team

Questions the board cannot answer, and the answer to each.

Open the number, find what is stuck

An average hides the worst cases. Sort work items by the time they spent in any status and see exactly which ones are stuck, each with a link to the work item.

  • Time in every status for every work item, as a chart and as a table
  • Average and median by assignee, work type, priority, sprint, epic, label or space
  • Group several statuses into one, such as “In work”, or leave some out
  • Choose a period: the whole history, the last 7, 30 or 90 days, or a date range
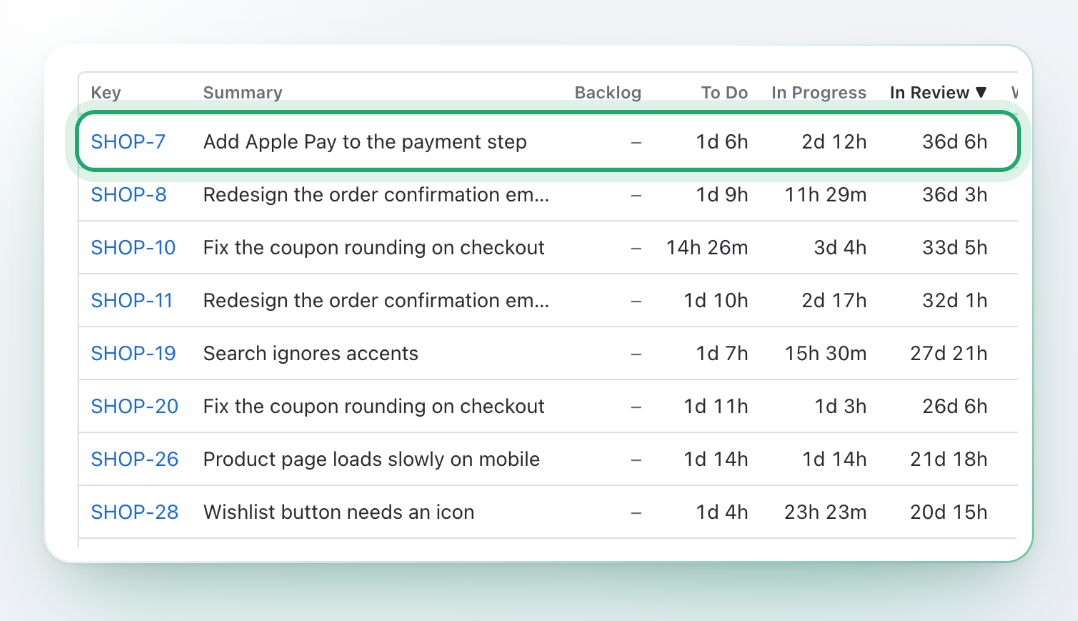
Work items sorted by time in In Review. The first row is ringed: SHOP-7, Add Apple Pay to the payment step, 36d 6h in review.

Count working hours, not weekends

Nights and weekends inflate every number, and then nobody trusts the report. Set your hours once, and every report counts only the time your team was at work.

  • Working days and hours for each day of the week
  • Holidays and a time zone, with daylight saving handled
  • A built-in 24/7 calendar when every hour counts
  • Show durations as days, hours and minutes, decimal days, hours or minutes
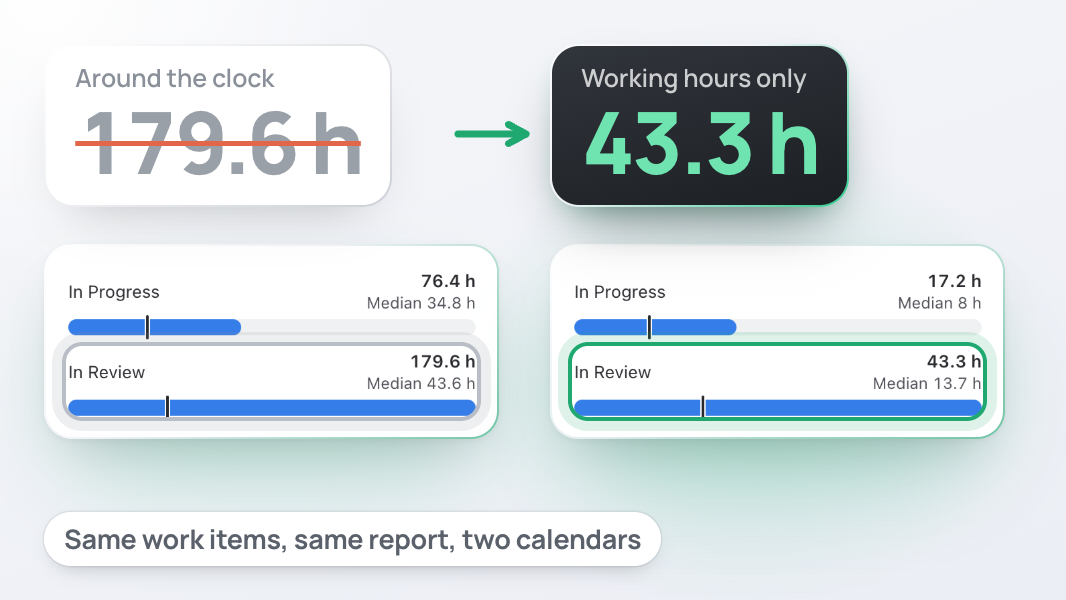
The same report on two calendars. Around the clock, work items wait 179.6 hours in In Review; in working hours only, 43.3 hours.

Know how long work really takes

“When will it be done?” Answer with data, not a guess. Choose the statuses that start and stop the clock, and see cycle time and lead time sprint by sprint.

  • Cycle time from the first entry into your start status to the last entry into your end status
  • Lead time from creation to the same moment
  • Average and median side by side, by sprint, epic, label, work type or assignee
  • Work still in progress is counted and shown, not hidden and not mixed into the averages
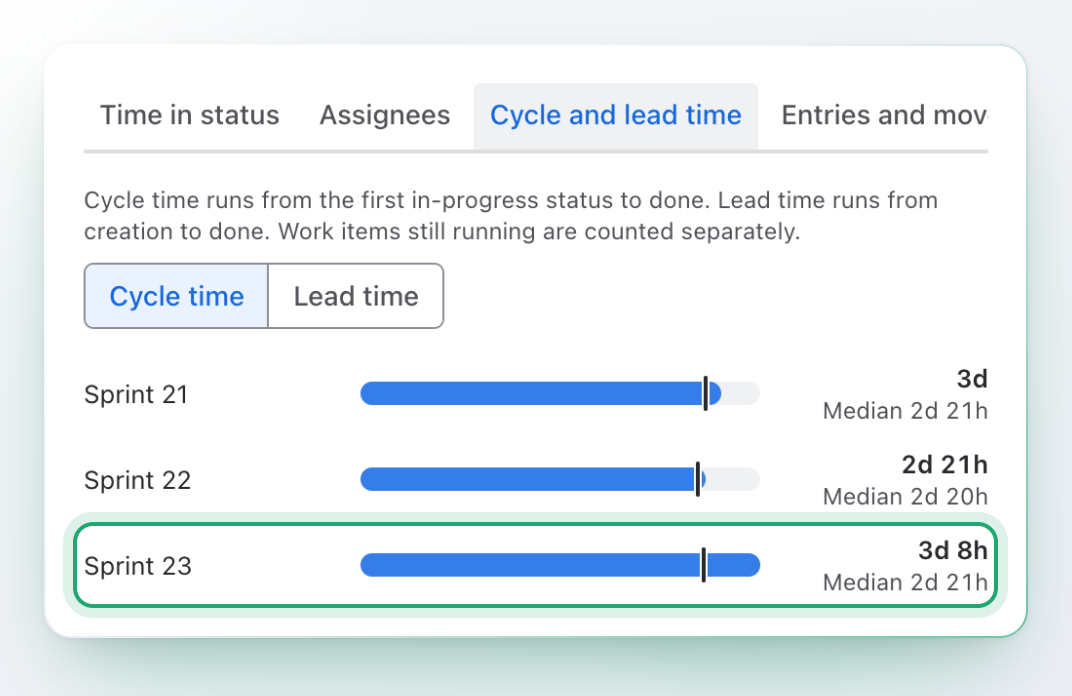
The Cycle and lead time report by sprint: a bar for each sprint with the average and the median. Sprint 23 is ringed: 3d 8h on average, median 2d 21h.

See who is waiting on whom

Work waits at the hand-offs. See how long each person held it, how long it sat with nobody, and how often it came back.

  • Time each person held each work item; unassigned time has its own row
  • First and last date a work item entered each status
  • How many times it entered a status and how many transitions it had
  • Names appear on screen and in CSV; nothing about people is stored
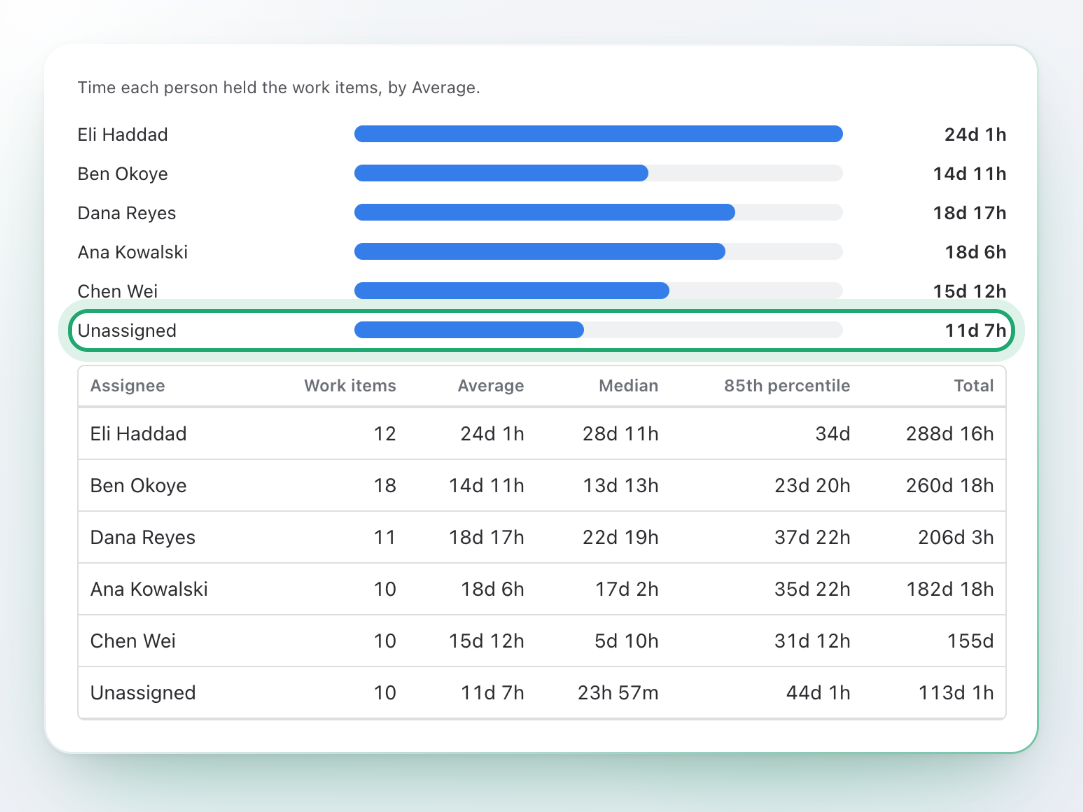
The Assignees report: a bar and a table row for each person, with the average, median and total time they held work items. The Unassigned row is ringed.

See what blocking really costs

Blockers hide inside the average. When a work item is flagged, the clock keeps running. A separate report shows how long that was.

  • Time each work item stayed flagged, and what share of its life that was
  • The total and the average on one line, ready for the retrospective
  • Reads the standard Jira flag, nothing to configure
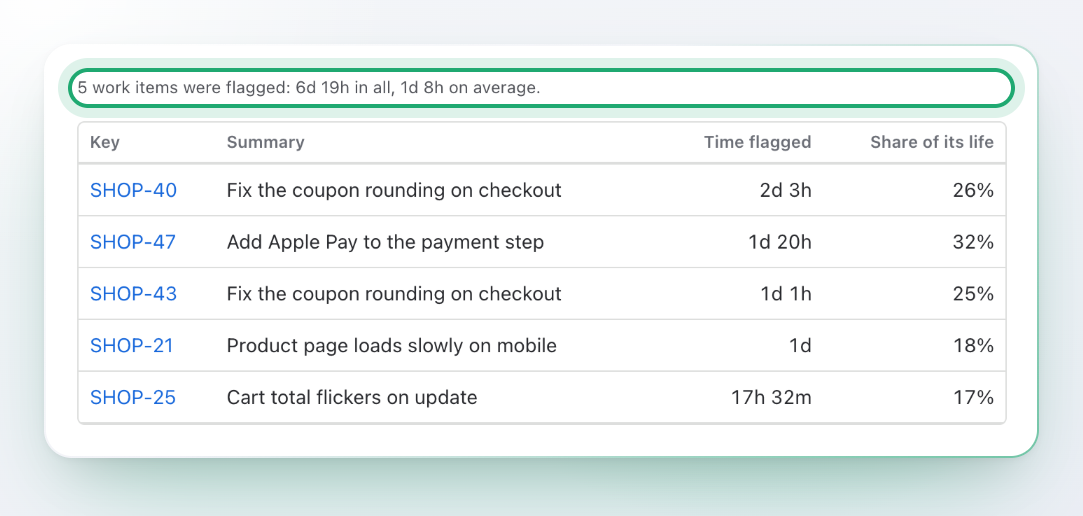
The Blocked report: five work items were flagged, 6d 19h in all. A table lists each one with its time flagged and the share of its life.

The answer on every work item

“Why did this one take so long?” Open the work item and see where it spent its time, with its cycle time, lead time and everyone who held it.

  • A strip of time per status, with the share of each
  • Cycle time, lead time, status changes and time flagged
  • Time with each assignee
  • Updates when the work item moves to another status
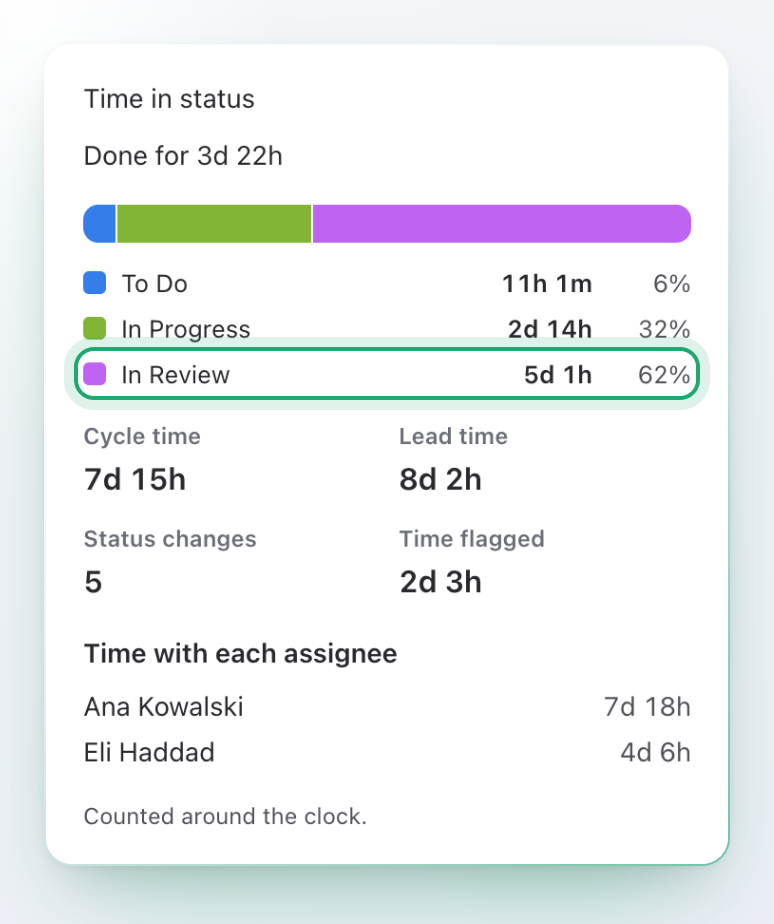
The Time in status panel on a Jira work item: a strip of time per status, with In Review ringed at 5d 1h, then cycle time, lead time and time with each assignee.

Keep it on the team dashboard

Numbers nobody sees change nothing. Put them where the team already looks, save the reports you run every week, and take the numbers with you.

  • A dashboard gadget with bars per status and three numbers: work items, average cycle time and lead time
  • A tab in every space that starts with that space already chosen
  • Saved reports, one click away
  • CSV export for Excel or Google Sheets
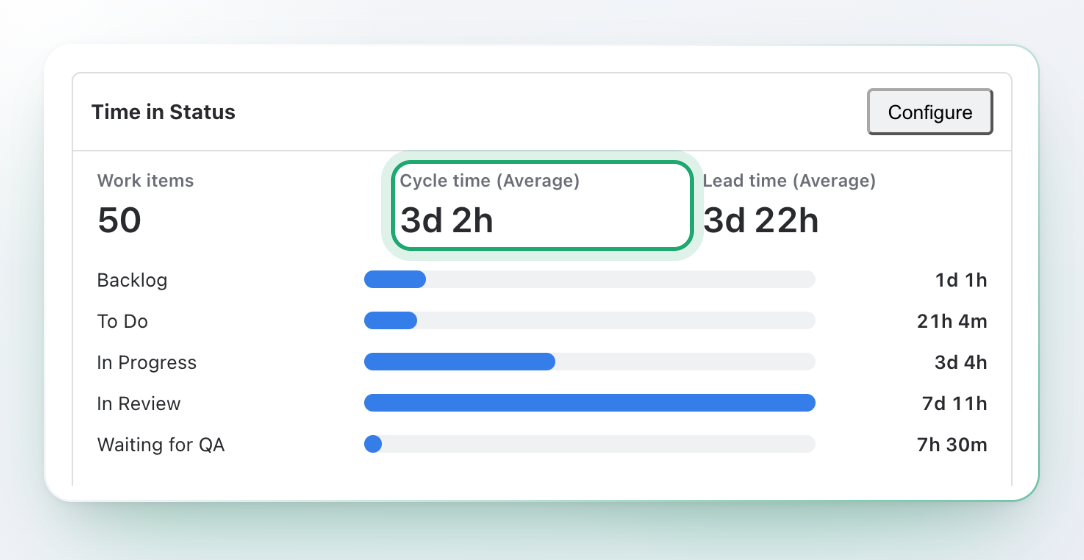
The Time in Status gadget on a Jira dashboard: 50 work items, cycle time 3d 2h on average, lead time 3d 22h, and a bar for each status.

From install to first answer in three steps

No set-up on your statuses or workflows. The history is already in Jira.

  1. Ask a question in JQL

    Open the app from the Apps menu or a project tab and type the work items you care about, for example the last 30 days of finished work.

  2. Run the report

    Pick a calendar, a group and the numbers to show, and press Run report. You see progress as the history is read, and you can cancel at any time.

  3. Read it, save it, share the numbers

    Switch between the tabs, open a group down to single work items, save the report and export CSV.

Your data stays in Jira

Reads only. Writes nothing.

The app is built on Atlassian Forge and has no external servers. Reports are calculated in your browser from what Jira shows you. It never changes a work item, and it keeps no work item data, no report results and no names. It uses no AI.

Read-only by design

It can read work items and keep its own settings. It has no permission to write to a work item.

No external servers

No copies elsewhere, no analytics, no third parties.

Jira permissions apply

Reports run as the person who opens them, so they never show more than Jira would show that person.

Two permissions, each with a reason

Read work items, and app storage for saved reports and calendars. See the docs.

Premium

For teams that compare, trend and share their numbers.

Several working calendars

One calendar for support, another for engineering, another for a team in a different time zone. Choose one per report.

Trends

Weekly and monthly trends of cycle time and lead time, with the 85th percentile, to see how your flow is moving over time.

Compare two periods and share reports

Set two periods side by side to see what changed, and share saved reports with the whole team.

Questions and answers

What does Stepwise Time in Status for Jira show?

How long every work item spent in every status, who held it, when it entered each status and how often it came back. Also cycle time, lead time and blocked time, with averages and medians by assignee, type, priority, sprint, epic, label or project.

Does it count working hours?

Yes. Set a working calendar with days, hours, holidays and a time zone, and a report counts only working time. A built-in 24/7 calendar counts every hour.

How are cycle time and lead time defined?

Cycle time runs from the first time a work item enters your start status to the last time it enters your end status without leaving it again. Lead time runs from creation to the same moment. By default the start is any In Progress status and the end is any Done status, and you can change both. A work item that is not finished is shown as in progress and is left out of the averages. The docs list every rule.

Can I see time per assignee?

Yes. The Assignees report lists the time each person held each work item. Time when nobody was assigned has its own row.

Does it work on the work items I already have?

Yes. It reads the history Jira already keeps, so old work items are covered from the first run. You do not change your statuses or workflows.

How many work items can one report cover?

Up to 5,000 work items in one report. If your JQL finds more, the report says it shows the first 5,000. Narrow the JQL by project, period or sprint to focus it. A report is a snapshot taken when you press Run report, and it shows the time it was taken.

What if Jira asks the app to slow down?

Jira limits how fast apps may read. When it asks the app to wait, the report waits and shows a countdown. If the wait is too long, it stops, shows what it already has and marks the report as incomplete, with a Continue button. We have tested these cases against a stand-in for Jira; how often large reports meet the limit on busy live sites is still being measured, so for the biggest reports narrow the JQL.

Does it write anything to my work items?

No. It only reads. It adds no field, comment or label, and it changes no history.

Where does my data go?

Nowhere else. The app is built on Forge with no external servers. Reports are calculated in your browser from data Jira already shows you. The app stores only report settings and calendars, not work item data, results or names. It uses no AI.

Can I export the numbers?

Yes. Export any report as CSV and open it in Excel or Google Sheets.

Does it work with Jira Service Management?

Support for Jira Service Management projects is not part of this release. It is on the list of things we want to add.

Does it support dark theme?

Yes, it follows each person’s Jira theme automatically.

Find out where your work really waits

Install it, type a query, run your first report. No set-up on your statuses.